
Historical Context
This project was partly inspired by research done by the community at West Bottom Church in Fluvanna, County. The members there, including those on our current team: Melissa Hill and Nadine Armstrong, wanted to connect with the past, with their ancestors, many of whom were buried at Oak Hill Cemetery. This looking back resulted in the discovery of many names of ancestors. A stone marker has been made to commemorate the names of those ancestors who were buried, but without markers. The West Bottom community is contiguous with the remains of the Glen Arven plantation that lies on the mightly James River. Presumably the buried in Oak Hill cemetery originally lived on Glen Arven plantation.
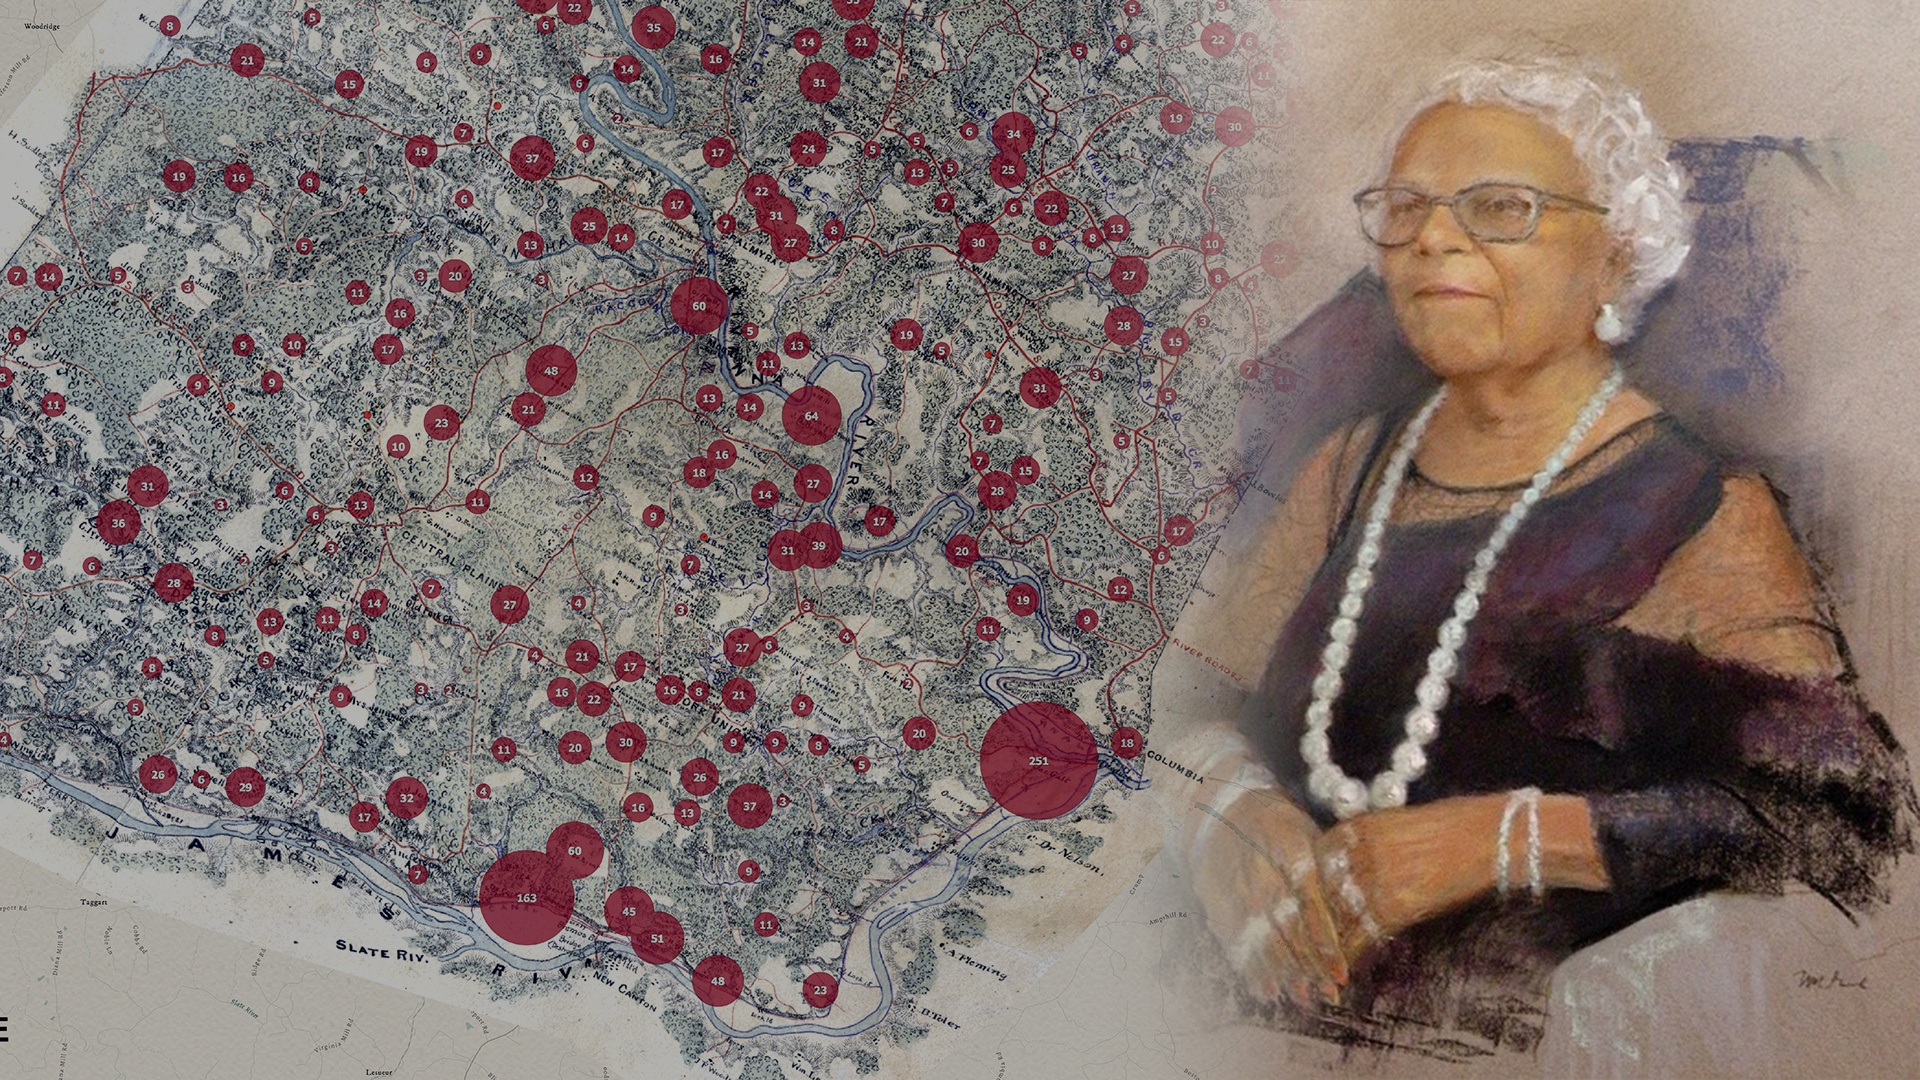
Since there are many similar communities in Fluvanna County, there was interest in determining where other black Americans were living before Emancipation at the end of the Civil War. We worked with One Shared story.org for purposes of mapping locations.
Toward that end, data was scraped from the internet from the national census of 1860, at which time a “slave schedule” was also compiled which indicated, by the name of a land holder, the number of persons enslaved. The names of enslavers were correlated with names on a map generated in 1863 by the Confederate States of America.
In addition to those datasets, we consulted the tax records of 1867, at which time possessions were tabulated, but recorded segregated by race. The final graph to follow shows the wealth disparity between the white and black citizens in Fluvanna County shortly after Emancipation.
-

Information on this graph was developed from a combination of the 1860 Federal Census and the 1860 Federal Slave Schedule, done contemporaneously with the census.
Looking back on this time, it is tempting to judge the enslavers for what we now view as inhumanity. However, there was a “normalization” of the commercial practice of enslavement. We must not forget that in another 150 years from now, many things that we view as normal now, may be considered inhumane by future generations.
-

This graph shows that there were approximately 594 sites of enslavement. You can see that about 50% of the enslaved were in households with 5 or less individuals.
For this graph, we processed the census data with the aide of One Shared Story. Our researchers had developed an ability during the preceding year in reading the style of script from the 1860s by cataloging the letters from the families associated with John Hartwell Cocke and the Bremo Plantation.
-

The population of African Americans and European Americans was approximately equal.
For this graph, we processed the census data with the aide of One Shared Story. Our researchers had developed an ability during the preceding year in reading the style of script from the 1860s by cataloging the letters from the families associated with John Hartwell Cocke and the Bremo Plantation.
-

This graph is drawn from the Fluvanna County tax schedule in the year 1867, after Emancipation. You can see that, although the European Americans represented only half the population, they possessed a remarkably higher amount of wealth. From this we can deduce the incredible perseverance of the Black communities that developed after Emancipation in being able to survive and build their communities.
